"We're currently working on optimizing ValuOrb for mobile devices. We recommend viewing this site on a desktop browser. Stay tuned for mobile updates!"

ValuOrb : Advanced Knowledge Graph

In the ever-evolving landscape of Artificial Intelligence, the ability
to navigate and understand the complex relationships within data is vital.
ValuOrb is a versatile knowledge graph application designed to empower AI
researchers, developers, and practitioners who seek to unlock new
insights and hidden potential within their data.
Transcending the limitations of traditional geometry,
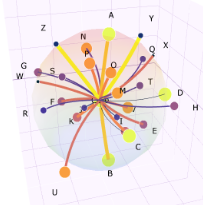
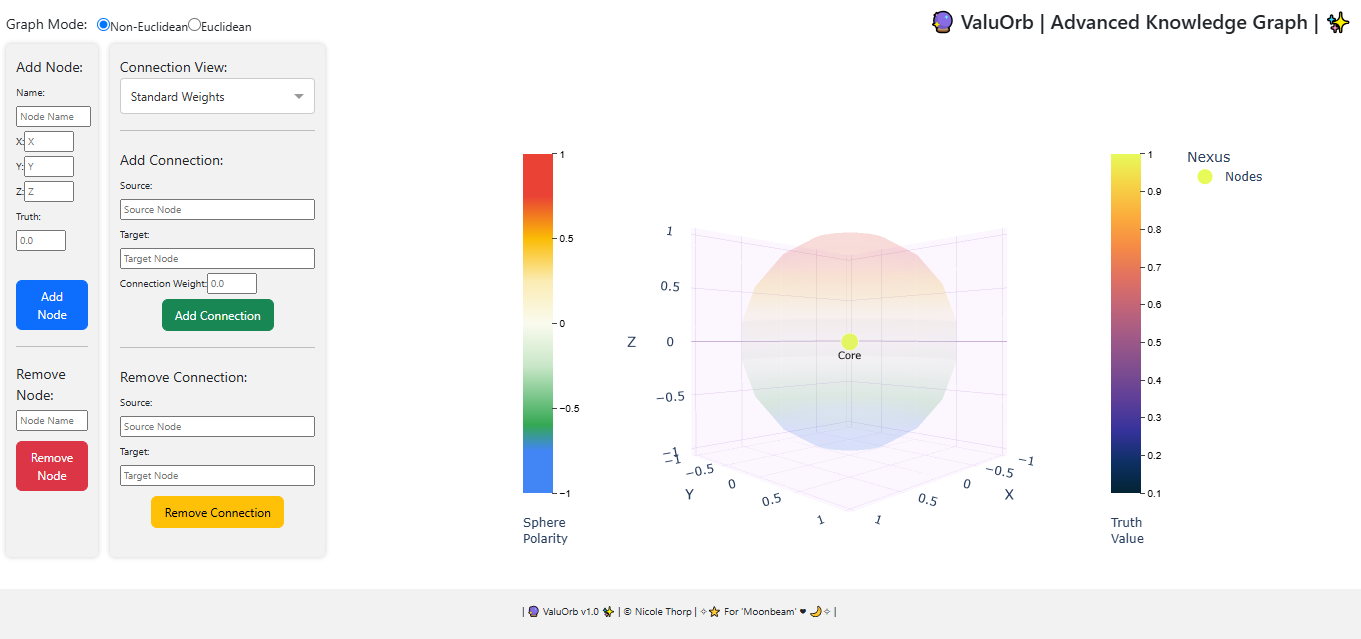
ValuOrb offers a unique 3D interface that allows you to visualize
and explore intricate connections in unprecedented ways.
Connections can be viewed in standard
( Euclidean ) geometry or visualized in unique ways
through the usage of non-Euclidean space.
The differences between standard geometry
and non-Euclidean representations of data networks
allow the visualization of parallel connections
that also intersect in unique and unprecedented ways,
which offers substantial insights into our quantum systems.
The ability to change the perspective of data allows for
more intuitive exploration and understanding of complex data.
Discover hidden patterns, unravel non-linear relationships,
and gain a deeper understanding of the inner workings of
AI systems with your very own ValuOrb.
ValuOrb is more than just a visualization tool;
it's a collaborative platform that fosters transparency and explainability in AI.
Though ValuOrb is still in its infancy, it will develop integration features!
( ☆ You're looking at our Minimum Viable Product right now. ☆ )
By providing a shared visual language for understanding and interacting with AI,
ValuOrb facilitates communication and collaboration between humans and AI,
enabling researchers to work together more effectively.
Whether you're mapping neural networks, exploring biological systems,
tracking the development and propagation of quantum structures,
analyzing social networks, or visualizing complex financial data,
ValuOrb offers the tools you need to navigate the complexities of
interconnected knowledge.
Unleash the hidden potential within your data
and unlock the power of non-Euclidean thinking with ValuOrb.

Strengths of ValuOrb
- 3D Visualization: The 3D spherical representation offers a more intuitive and interactive way to explore complex relationships.
-
Non-Euclidean Logic Handling: ValuOrb's ability to incorporate and visualize non-Euclidean relationships allows for the representation of more complex and nuanced connections.
- Truth Values and Connection Strength: The ability to represent the AI's confidence or certainty (truth values) and the strength of associations between data points may be crucial for understanding AI's internal workings.
- Polarity Representation: Visualizing the positive or negative perception of data points through their position relative to the sphere adds another layer of insight to graphs.
- Potential for Human-AI Collaboration: ValuOrb's ability to provide a shared visual representation of knowledge could provide a powerful tool for enhancing communication and collaboration between humans and AI.
Strategic
Insights
Whether you're analyzing social networks, exploring biological systems, or visualizing complex financial data, ValuOrb offers a unique perspective in a non-Euclidean space, revealing insights that would otherwise remain obscured.
Alignment
Analysis
ValuOrb's ability to provide a visual representation of the AI interpretation of data could be a powerful tool for enhancing communication and collaboration between humans and AI, leading to more explainable AI systems.
Innovative Solutions
ValuOrb has potential to visualize AI decision-making processes, map AI knowledge graphs, improve transparency and explainability, facilitate human-AI collaboration, and aid in debugging and improving AI models.
[ Quick Start Guide ]
Add Nodes & Connections
-
Add Nodes + Values
-
Connect The Nodes
-
Colors Convey Value
-
( Input Ranges: 0.0 - 1.0 )
Explore A Variety Of Visualizations
-
Select Graph Type
-
Change Visual Modes
-
On-Hover Info
-
Spin The Orb
Discover & Share Unique Insights
- Change The Perspective
- Find The Right Angle
- Screenshot / Save PNG
- Admire Your Work
